As a way to understand total expenditure on lifestyle apps such as Ola, Uber, Swiggy, Zomato, BigBasket etc., I scraped/ downloaded my own personal data a while ago. (Read here)
Here I attempt to read and understand it.
Swiggy vs Zomato
I’ve spent a grand total of 1.6 Lakhs (!) on food delivery apps combined in my lifetime. With a total of 1090 delivered orders, my average order size has been just under a modest 150/- .
I’ve ordered in 8 different cities with the bulk of orders in Delhi and Pune. Here’s two comparison charts.
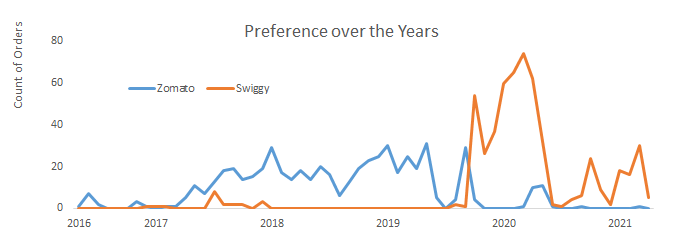
I became a Swiggy fan at the beginning of 2020. And now I prefer it exclusively unless I find ridiculous discounts on Zomato.
Here’s my expenditure pattern:
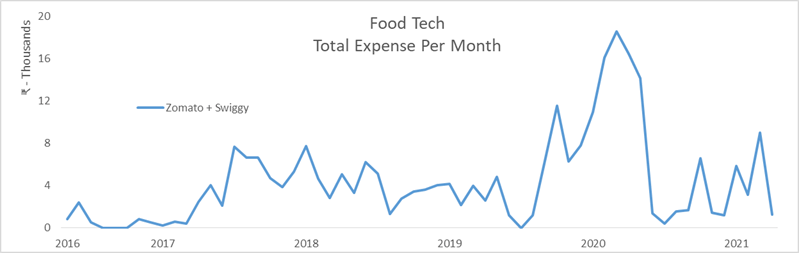
The graph for 2020 is way too high with expenses touching 20 thousand per month. That’s because for 3 months in Pune, I lived without a kitchen with all 3 of my meals coming from restaurants.
Uber
Uber data shows a lot more cities than food delivery. I’ve sat in an Uber in 10 cities across 3 countries – India, UAE and Nigeria. I have been dropped at approximately a 100 different locations across my lifetime with Uber.
However, I’ve had 0 rides in 2021 courtesy of the pandemic. Here’s a breakdown over the years

The least I’ve paid for a ride is 16/- INR for 1.6kms on an UberBike and the most was 606/- in an UberGo
Thanks for reading

One reply on “Expenditure tracking on online lifestyle apps – analysis part 1/2”
[…] continuation of the previously published two posts (Sourcing the data, and Analysis part 1), I now bring the the third post of the series, which is part 2 of the […]
LikeLike