In continuation of the previously published two posts (Sourcing the data, and Analysis part 1), I now bring the the third post of the series, which is part 2 of the analysis.
Recap (optional to read)
In 2020, I thought about building an expense tracking app. I quickly lost focus and then pivoted to building an expense tracking API, which wasn’t easy and at the first sign of sustained difficulty, I settled on publishing just a blog post of my own expense analysis along with chunks of the code I created.
Further recap (optional to read)
I published an analysis of my Swiggy, Zomato expenditures and Uber expenses. I had tried Ola and Amazon too but dropped the idea. Ola website doesn’t have a user login or user account concept. In any case, they flat-out told me they don’t even store data beyond 100 rides (or 100 days…) themselves so it was pretty much pointless to even try and engage with their bug ridden non-governed systems. While I tried scraping Amazon data, it was structured and sophisticated and my basic coding capabilities couldn’t handle the site pagination, page layout and reloads, so I dropped the idea because 3 apps were good enough for the blog post at the time.
The re-attempt at analysis
The previously incomplete project kept pulling a thread inside my head and I finally found myself in a position to try again. One more thing had changed since 2020 – I have developed better, sharper and more sophisticated skills – technical and overall.
I gave it a scrappy attempt. Spent a good 10 hours making progress. Extracted almost all orders from 2024 in a useable format. Took a break. Just browsed through settings and options in my Amazon account…. And discovered a ‘Request your data’ button 😅
Two clicks later, feeling a mixture of happiness and relief, I further spent 5 mins questioning my natural inclination to always end up choosing a path full of misery…
And then I moved on to the analysis structure.
Amazon dot… in? ca? sg? ae?
I realised apart from Amazon India, I have an account and have placed orders on Amazon Singapore – a significant amount, and maybe on amazon Canada and amazon UAE as well.
For this analysis, I have chosen to study from orders from only Amazon[dot]in. Later, I might check and publish another analysis of orders from the non-India websites.
Account hygiene
While the internet and e-commerce is ubiquitous now, in the early days, even for an engineering graduate like me, the concept of account hygiene was an alien one.
Sure, today we all maintain our own email accounts, phone numbers and individual app accounts – even parents, but in 2018 that wasn’t even a requirement.
While I have orders in my Amazon India account since 2018, for a long time before 2020’s, myself and the entire family placed orders on my brother’s account. He had created one during his education years and we found it super convenient to keep ordering from the same one.
It’s the very same reason why my account’s prime membership fee spend is unexpectedly less.
Order analysis
Amazon order data insights; without any tagging or processing of return and refunds.
| Metric | Value |
| Total retail products ordered | 1077 |
| Total orders placed | 891 |
| Total retail orders value | ₹10,69,943 |
| Prime membership fees (INR) | ₹2,498 |
The retails orders exclude any digital orders such as kindle ebook etc. Out of the total retail orders, a small fraction is on Amazon Fresh – for groceries (₹8k out of ₹10.69 lakhs)
| Metric | Category | Value |
| Total orders value | Amazon Fresh | ₹8,053 |
| Product with lowest value | Amazon Fresh | ₹9 |
| Product with highest value | Amazon Fresh | ₹569 |
| Max products in one order | Amazon Fresh | 17 |
| Metric | Category | Value |
| Total orders value | All other retail orders | ₹10,61,890 |
| Product with lowest value | All other retail orders | ₹39 |
| Product with highest value | All other retail orders | ₹62,990 |
| Max products in one order | All other retail orders | 10 |
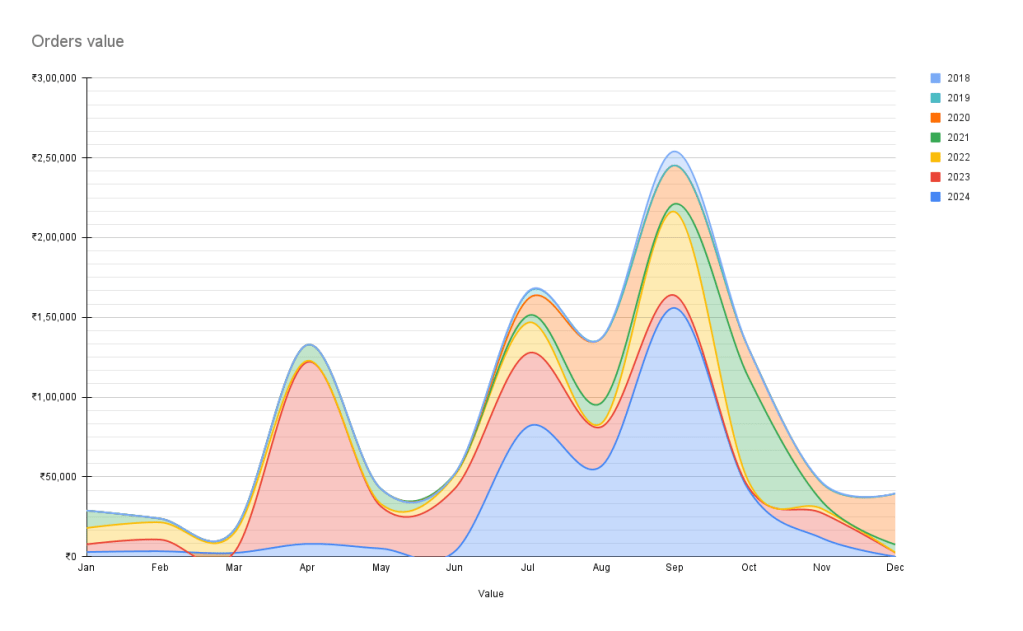
It’s interesting to see the trend of orders placed by year, clearly showing an increasing amount of order volume.
| Year | # of products | # of orders | Total value |
| 2024 till date | 336 | 275 | ₹3,72,230 |
| 2023 | 321 | 282 | ₹2,90,062 |
| 2022 | 130 | 106 | ₹1,24,042 |
| 2021 | 136 | 98 | ₹1,32,721 |
| 2020 | 140 | 116 | ₹1,36,774 |
| 2019 | 3 | 3 | ₹4,184 |
| 2018 | 11 | 11 | ₹9,932 |
The healthy relationship with Amazon seems to be growing over time and is likely to continue.
The number of yearly orders, by itself, shows an overall growth trend. But if we add a cross- section of the monthly data, we uncover a new and interesting pattern. This graph below shows a clear spike in the order numbers in the second half of the year, with peak order values in September. Every year. Provides an excellent self- discovery topic.
Returns, replacements and refunds
One of the biggest reasons I feel super at ease ordering from Amazon, is the no-nonsense structured returns, replacements and refunds process.
Do not mistake the presence of a comfortable no-nonsense policy with the absence of a policy.
From raising the request, to completion of the request – the entire process chain is mapped out and is as comfortable as placing an order itself.
Stats and analysis
Return and refund data summary
| Metric | Value |
| Total returned products | 135 |
| Total refunded amount | ₹1,19,213 |
| As a % of ordered products | 12.5% |
| As a % of ordered value | 11.1% |
If the goal for amazon is to try and achieve minimal customer need for returns and refunds, then the year 2023 stands out as the best one, at a 7% return rate for ordered products.
| Year | Returns | Returns as % of products ordered |
| 2024 till date | 34 | 10% |
| 2023 | 23 | 7% |
| 2022 | 30 | 23% |
| 2021 | 24 | 18% |
| 2020 | 22 | 16% |
| 2019 | 0 | 0% |
| 2018 | 2 | 18% |
Returns classification
While the return reasons section has several categories, I am skeptical of reading too much into it for three reasons:
- I, myself, have often, mis-categorised the return reason either in haste or for the want of a particular outcome.
- The categories ‘Customer return’ and ‘Item not satisfactory’ appear in the same column which seems erroneous as the latter is most definitely a subset of the former.
- While ‘Refused to accept delivery’ remark has had a few genuine instances in my case, there is still a high likelihood of incorrect tagging by errant delivery personnel.
Here’s a break-down of the return reasons:
| Return reason | Supply chain issue with no customer participation? | % amongst all reasons |
| Customer return | – | 73% |
| Item not satisfactory | – | 3% |
| Unable to deliver | Yes | 1% |
| Order cancelled | Maybe | 5% |
| Account adjustment | Yes | 2% |
| Item shipped late | Yes | 1% |
| Refused to accept delivery | – | 4% |
| Damaged during transit | Yes | 4% |
| Wrong item was sent | – | 5% |
| Item not received | – | 2% |
For an e-commerce operator, a key learning from the data is that unsuccessful deliveries happen sometimes for reasons that do not involve the customer. And that such instances may be studied and investigated without involving the customer at all.
| Case | Customer participation |
| Refund due to customer’s subjective preference of poor quality | Yes |
| Refund due to shipment damage in transit | No |
Cases of failed deliveries with absolutely no customer participation stand between 8% to 13% in this case.
